

How to read a map scale and calculate real distances

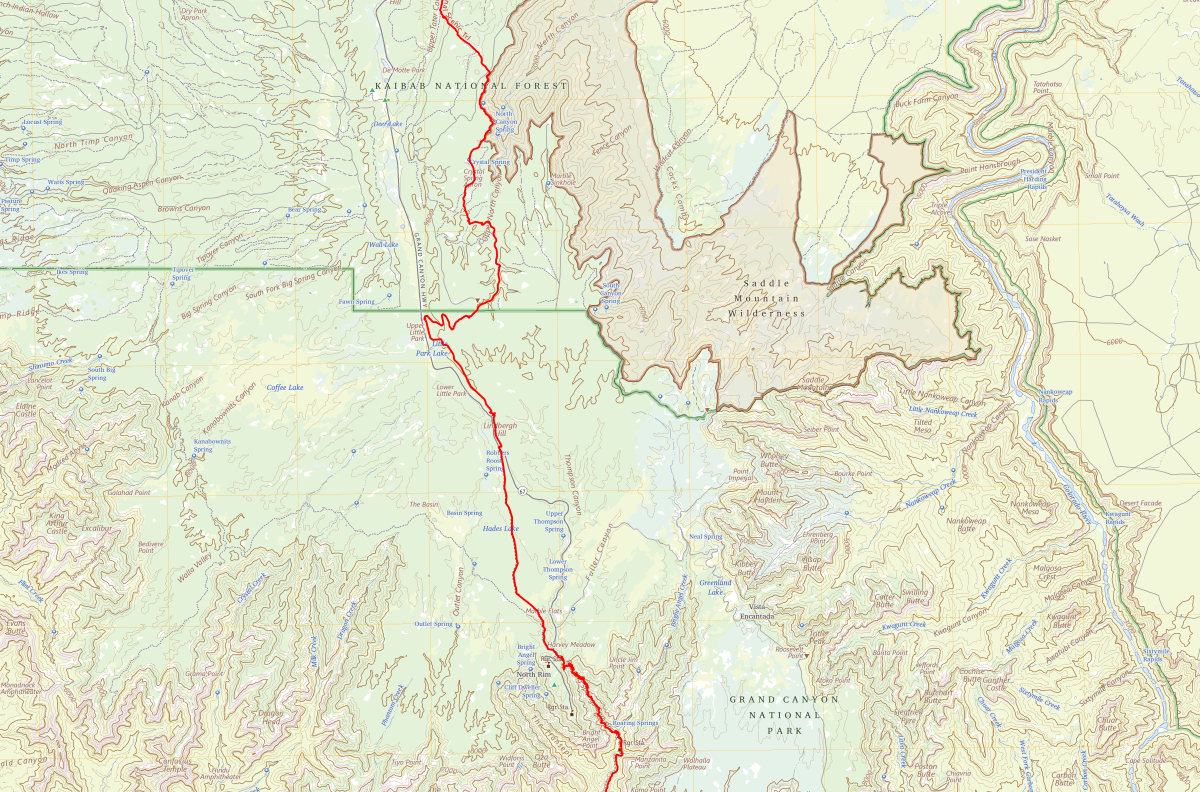
USGS map extract of the Kaibab Plateau and Grand Canyon North Rim, with the Arizona National Scenic Trail in red. Mapping originally at 1:100,000; displayed at a different size. Public domain.
A map scale expresses the relationship between a distance on a map and the corresponding distance on the ground. On a map printed at 1:50,000, one centimetre represents 50,000 centimetres, or 500 metres. To calculate a distance, read the scale, measure the line or route you need, then convert the result into metres or kilometres.
Key facts
- A ratio uses the same unit on both sides: 1:25,000 means one centimetre represents 25,000 centimetres.
- At 1:25,000, 1 cm represents 250 m; at 1:50,000, it represents 500 m.
- A larger-scale map has a smaller denominator and generally shows more detail.
- Resizing a map changes its printed ratio. A scale bar remains useful when it resizes with the map.
- Measure a winding route along its bends, rather than using the straight line between its endpoints.
What does a map scale of 1:50,000 mean?
Read the colon as “to”. The ratio 1:50,000 means one unit on the map corresponds to 50,000 of the same units on the ground. You could use centimetres, millimetres or inches, provided you keep the unit consistent during the multiplication.
The USGS teaching guide describes scale as a relationship between map distance and ground distance. The ratio gives a way of translating the reduced drawing back into a real-world length.
For centimetres, the useful conversion is:
Ground distance in kilometres = map distance in centimetres × the scale denominator ÷ 100,000.
The final division converts centimetres into kilometres: 100 centimetres make a metre, and 1,000 metres make a kilometre. Writing out those two stages helps prevent the common mistake of treating 50,000 centimetres as 50,000 metres.
Three ways a map can show its scale
- A ratio scale, also called a representative fraction, appears as 1:25,000 or 1/25,000. It provides a compact multiplication rule.
- A written scale states the relationship in words, such as “one centimetre represents 250 metres”. Here the units differ, so read both of them before calculating.
- A scale bar is a drawn line divided into labelled distances. You compare a measured map length directly with that line. Ordnance Survey explains these forms and why control of the print size matters for a ratio or written scale.
Check which units the bar uses. A map can provide separate bars for kilometres and miles, and a subdivided section can represent fractions of the main interval. Follow the labels and tick marks rather than assuming every visible division represents one kilometre.
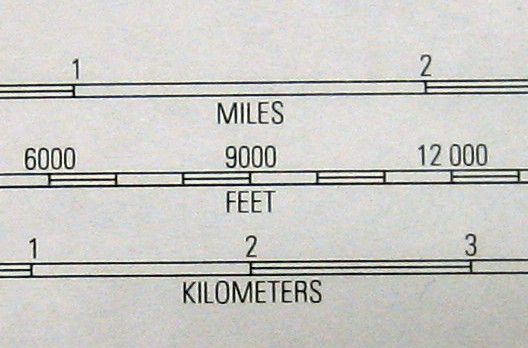
The USGS extract above comes from a separate 1:63,360 map. Use it to practise reading the labels: the interval from 1 to 2 on the kilometres bar represents one kilometre. It belongs to a different map from the featured topographic extract, so the two images cannot be combined to measure a route.
How to calculate distance in four steps
- Confirm the scale and print size. Find the ratio or scale bar in the margin. Check whether the sheet has been enlarged, reduced or printed to fit a page.
- Choose the distance you need. For separation between two places, measure the straight line. For a journey, follow the intended route.
- Measure and multiply. If you use a ratio, multiply the map measurement by its denominator, keeping the same units.
- Convert and check. Change centimetres into metres or kilometres. Compare the result with the scale bar, if one is available on that same map.
Worked example: centimetres to kilometres
Suppose two points on a correctly printed 1:25,000 map are 6.4 cm apart in a straight line. This is a hypothetical exercise, rather than a measurement taken from either image in this article.
- 6.4 cm × 25,000 = 160,000 cm.
- 160,000 cm ÷ 100 = 1,600 m.
- 1,600 m ÷ 1,000 = 1.6 km.
You can check the same answer using 1 cm = 250 m: 6.4 × 250 gives 1,600 m. Both methods describe the same straight-line separation.
Worked example: ground distance to map distance
Reverse the calculation when you know the ground distance and want its length on a map. Suppose a straight distance is 2.4 km and the map scale is 1:50,000.
Convert 2.4 km into 240,000 cm, then divide by 50,000. The result is 4.8 cm on the map. This is useful for checking a calculation or constructing a simple scale drawing.
Comparing common map scales
Geoscience Australia gives these relationships between scale and ground distance:
| Map scale | 1 cm represents | 4 cm represents |
|---|---|---|
| 1:10,000 | 100 m | 400 m |
| 1:25,000 | 250 m | 1 km |
| 1:50,000 | 500 m | 2 km |
| 1:100,000 | 1 km | 4 km |
The four-centimetre column is calculated by multiplying the one-centimetre distance by four. It gives a quick check when you move between maps with different ratios.
Why 1:25,000 is a larger scale than 1:50,000
Think of the ratios as fractions. One twenty-five-thousandth is larger than one fifty-thousandth, so a feature appears twice as long on a 1:25,000 map as on a 1:50,000 map printed at their stated sizes.
The ITC textbook, from the University of Twente, connects larger scales with detailed views of smaller areas. A smaller-scale map gives a wider overview, while its maker simplifies or omits features to keep the drawing readable.
Choose according to the task. A regional overview helps you see the relationship between distant places. A more detailed local map helps you distinguish nearby junctions and features. Enlarging an overview makes its existing marks bigger; it adds none of the detail omitted when that map was made.
How to measure a winding road or footpath
A ruler placed between the endpoints gives their straight-line separation. A route that bends around a river or follows a valley will cover a different distance.
In its distance guide, Ordnance Survey describes using string or the edge of a sheet of paper. Lay string along the route’s curves, mark the endpoint, then straighten the measured section against the map’s scale bar.
With paper, mark each successive straight section of the route and pivot the edge as the route changes direction. Compare the accumulated length with the bar. Shorter sections follow bends more closely than a few long lines that cut across them.
Keep the meaning of the answer clear. A map measurement gives an estimate from the represented route. Distance alone supplies no walking time: gradients, surfaces and stopping time need separate consideration.
What happens when a map is resized?
Imagine a 1:25,000 map reduced to half its original width and height. A ground distance that occupied 4 cm occupies 2 cm after reduction. The effective ratio becomes 1:50,000, even if the printed label still says 1:25,000.
A bar reduced with that map still represents its labelled ground distance. Compare the route with the resized bar, rather than trusting the unchanged ratio text. Both need to remain in the same image and undergo the same proportional resizing.
For a downloaded sheet, follow the publisher’s printing instructions and check any stated paper size. On a zoomable screen map, use its displayed scale bar or measurement tool; a physical centimetre on one screen need not represent the same ground distance on another.
When a scale cannot settle the measurement
Three details can limit an answer: the map’s source, its display size and the kind of distance being requested. A screenshot with neither a usable bar nor a known display scale leaves too little information for a ruler calculation.
Maps covering large regions also involve projection distortion. Ordnance Survey explains that a single scale can apply accurately along a particular line rather than equally everywhere on a world or continental map. For long distances, use a suitable geographic measurement tool instead of extending a local ruler method across the whole globe.
Scale also leaves other questions open. A legend explains symbols; a date and source help establish what the map records. CrispNG’s guide to historical maps illustrates why the purpose of a map matters alongside the lines it contains.
Frequently asked questions
Does 1:50,000 mean 1 cm equals 1 km?
One centimetre represents 500 metres at that scale. Two centimetres represent one kilometre, provided the map is printed at its stated size.
Which shows more detail, 1:25,000 or 1:50,000?
A purpose-made 1:25,000 map generally allows more local detail because features have more space on the page. Compare the actual maps as well: their content and purpose determine which features the maker includes.
Can I measure a map shown on my phone?
Use a scale bar that belongs to the displayed map, or the application’s distance tool. A saved ratio label alone cannot account for different screen sizes, zoom levels or resized screenshots.
How do I find the scale from two known distances?
Express both distances in the same units, then divide the ground distance by the map distance. If 5 cm represents 1 km, divide 100,000 cm by 5 cm: the scale is 1:20,000.
Sources and further reading
- USGS teaching guide, especially “Analysis of Scale”.
- Geoscience Australia, “What is Map Scale?”
- Ordnance Survey, cartography guide to scale.
- Distance guide, Ordnance Survey Mapzone.
- ITC textbook, University of Twente, “Map scale”.
Featured map: USGS, Grand Canyon North Rim and Kaibab Plateau, with the Arizona National Scenic Trail highlighted in red. Extract from mapping originally at 1:100,000; reproduced here at a different display size. Public domain. USGS image record.
Last reviewed: 27 October 2026