

Nigeria Jollof Price Drop: Why 11.5% Became 8.5%

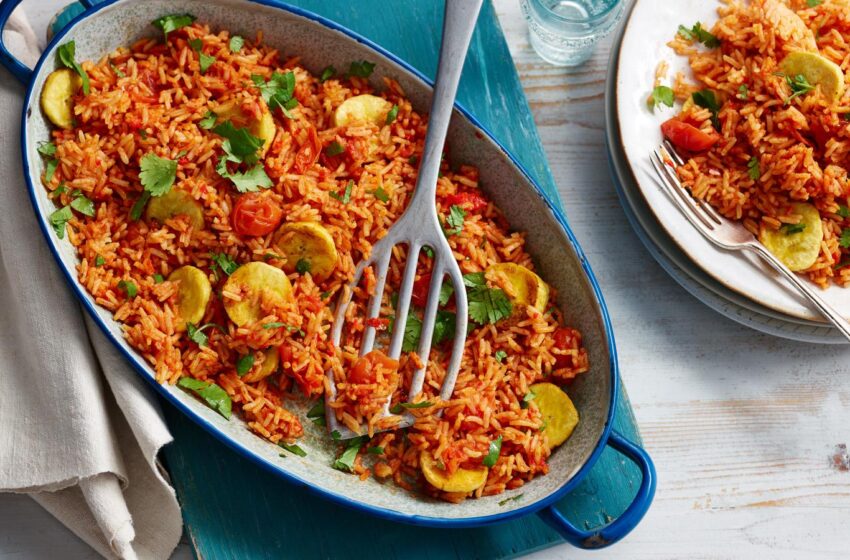
Nigeria’s jollof price drop looked larger than it was: the national average cost of a measured pot fell between June and September, but an Ibadan recording error reduced the adjusted decline to 8.5 per cent from 11.5 per cent. The difference matters when a national average is used to describe what households experienced.
Why the 11.5% figure became 8.5%
SBM Intelligence’s third-quarter 2026 Jollof Index put the national average at ₦29,578 in June and ₦26,178 in September, a decline of ₦3,400 or 11.5 per cent. The firm later said curry and thyme prices recorded in Ibadan’s Bodija and Dugbe markets had a unit-related error. Correcting it raises the September estimate to about ₦27,055 and reduces the quarter-on-quarter decline to 8.5 per cent.
That correction does not erase the downward movement. It does change its size. Readers comparing the figures should distinguish the index’s originally reported result from SBM’s adjusted estimate.
What the Jollof Index measures
The index prices a fixed basket of ingredients for one pot intended to serve a family of five, across 13 markets in Nigeria’s six geopolitical zones. Its basket includes rice, chicken, beef, tomatoes, oil, pepper, onions and seasonings. It is a consistent price-tracking exercise, not a survey of every household’s shopping basket or a restaurant price list. SBM describes its basket and method in its Q2 2026 index methodology.
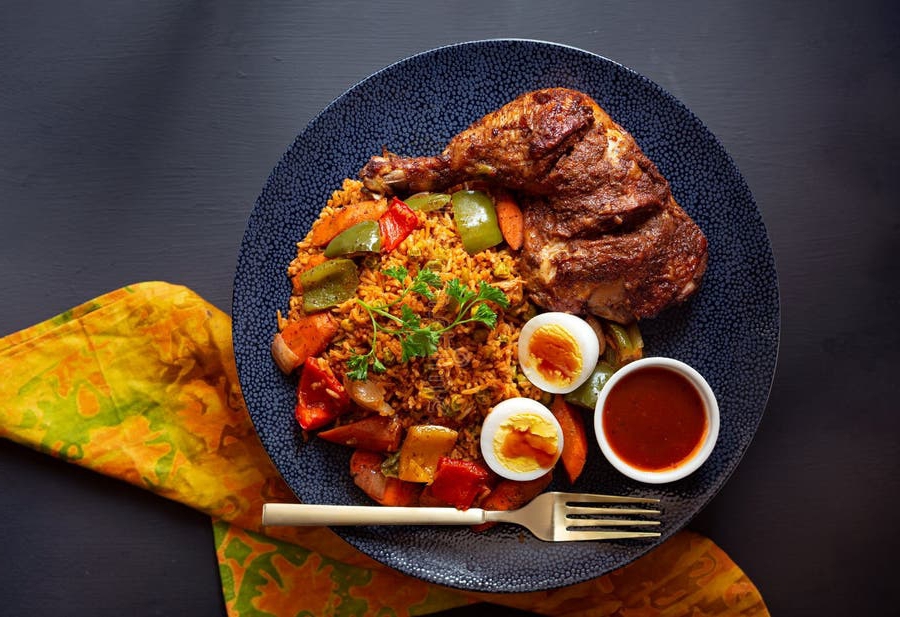
Why one national average can hide opposite experiences
The September figures varied widely by location. The report put Lagos’s Trade Fair and Balogun markets at ₦22,350, down 35.6 per cent from June. Port Harcourt moved the other way: its index rose 2.6 per cent, from ₦31,200 to ₦32,000. Calabar markets remained among the most expensive, while SBM described the South-East figures as provisional because some rice and beef prices needed further checking.
So a national fall does not mean prices fell equally in every market. The local figures—and the report’s own caveats—are essential to understanding what the average can and cannot say.
Cheaper than June does not mean cheaper than last year
Even before considering the Ibadan correction, the reported September average was 5.8 per cent above September 2025. The index also tracks a defined pot of ingredients, not the full cost of living. Rent, transport, school fees and electricity can still squeeze a household budget even when some food ingredients ease in price.
The useful takeaway is narrower than “food is now affordable”: the index recorded a real quarterly decline, but its size was smaller after a data correction, it was uneven across markets, and the September basket remained more expensive than a year earlier.
Sources and reporting notes
- Premium Times’ report on the Q3 Jollof Index, including market-level figures and the Ibadan recording issue.
- Punch’s report on SBM’s adjusted 8.5 per cent estimate.
- SBM Intelligence’s Q2 2026 methodology note for the index basket and rebasing context.
The June-to-September and corrected figures are attributed to SBM Intelligence’s Q3 2026 report, as reported by the outlets above. The index is a monitored basket, so it should not be read as a direct measure of every household’s food costs.